The graphs show changes in spending habits of people in UK between 1971 and 2001.
Write at least 150 words.
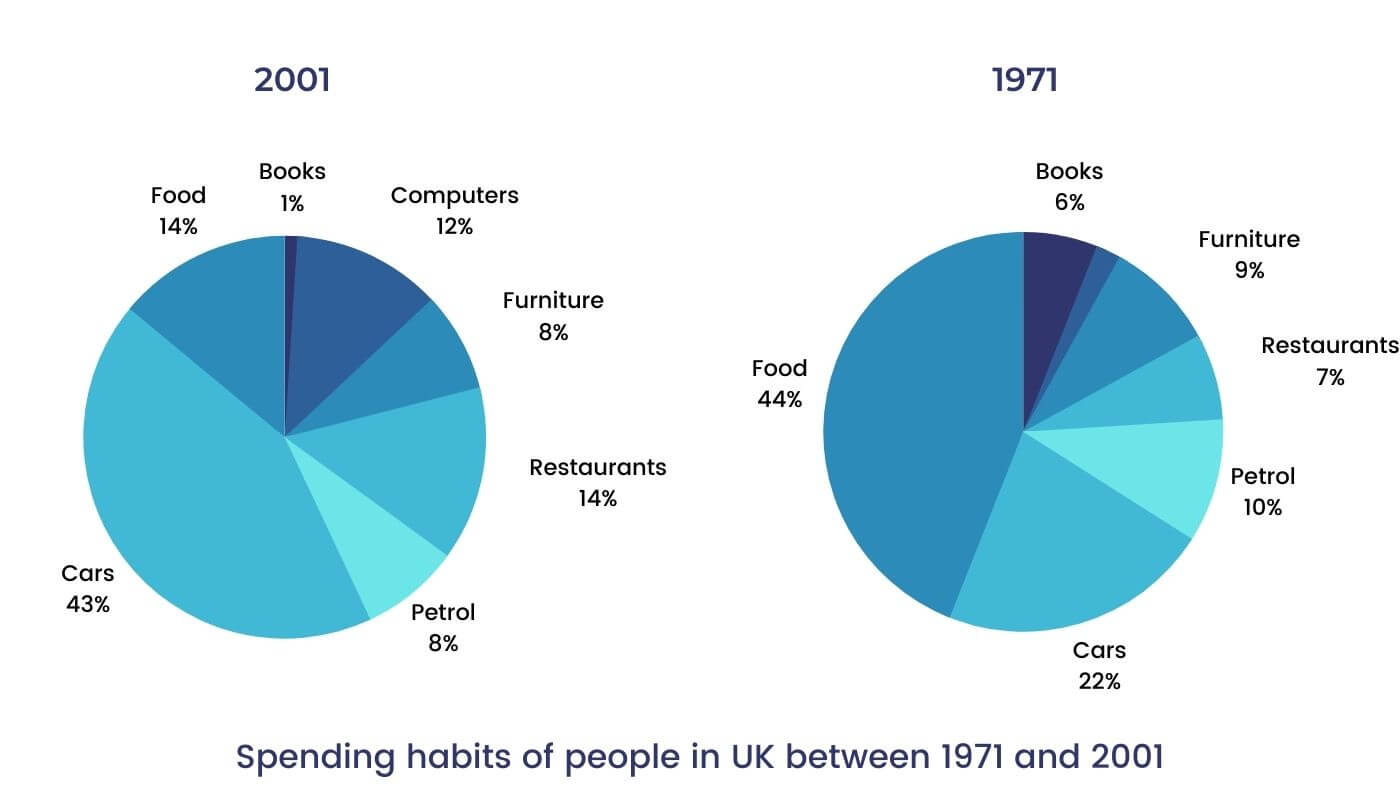 The pie charts demonstrate changes in the spending patterns between 1971 and 2001 in the UK.
The overall trend shows an increased amount of money spent on cars, computers and eating out.
Talking about it in detail, food and car turned out to be the two biggest items of expenditure in both the given years. Together, they encompassed more than half of household spending in the UK. In 1971, food accounted for 44% of the expenditure. In 2001, it saw a drop by two thirds and reached up to 14%. Also, the spending on cars turned twice, increasing from 22% to 43%.
Significant change can be seen in other areas as well. Outlay on eating out doubled, climbing from 7% to 14%. A dramatic increase in the proportion of salary spent on computers can also be observed, up from 2% to 12%. However, with a striking upsurge in computer expenditure, the percentage of expenditure on books plunged from 6% to 1%.
Comments
Post a Comment