The graph below shows different sources of air pollutants in the UK from 1990 to 2005.
Summarise the information by selecting and reporting the main features, and make comparisons where relevant.
Sample:
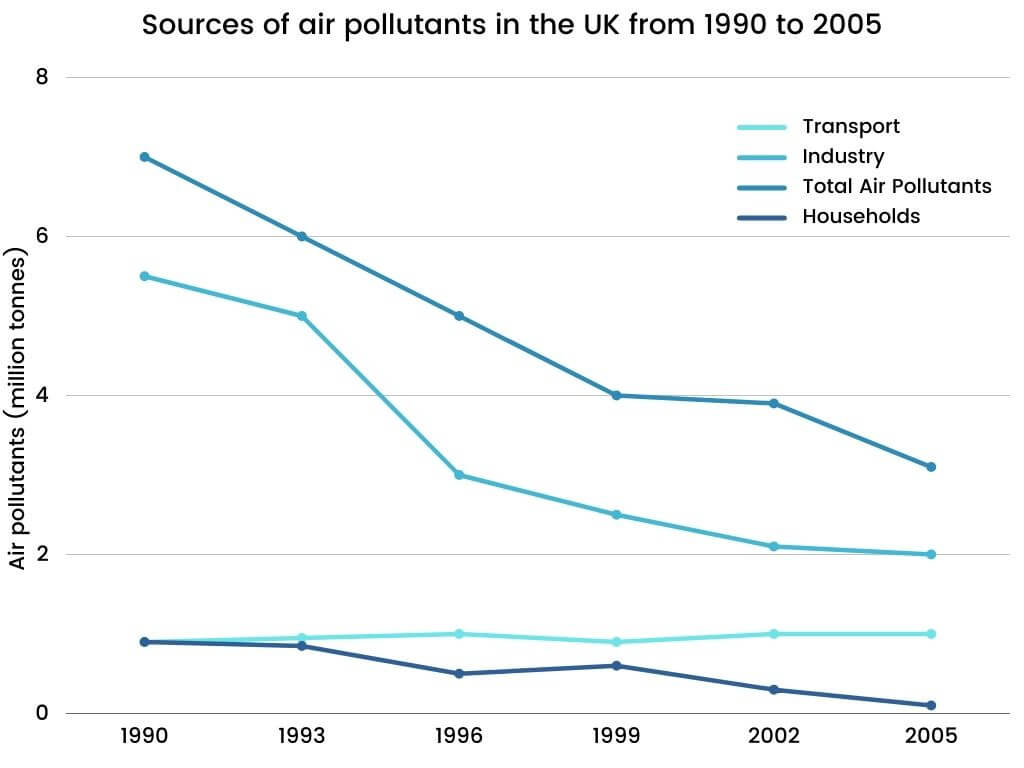
The line graph illustrates data on three different sources of air pollutants in the UK during the period 1990 - 2005.
The total volume of air pollutants in the UK, in 1990, was nearly 7 million tonnes. This figure had a sharp decline to 4 million tonnes in 1999. After that, it continued experiencing a dip to just over 3 million tonnes towards the end of the said period.
5.5 million tonnes of air pollution was taken by the industry in 1990. And then, throughout the period, there was a decline, and the figure reached up to 2 million tonnes by 2005, with a specific sharp decline between 1993 and 1996. Contrarily, the air pollutants' amount was less from the sources of transport and household. From transport, air pollution stayed almost same at approximately 1 million tonnes from 1990 to 2005. On the other hand, pollutants from households fell from nearly 1 million tonnes to almost 0.1 million tonnes in 2005.
Overall, it is evident that the total amount of pollutants in the air has decreased over the given time period being the fall in air contaminants from industrial sources predominantly substantial.
Comments
Post a Comment