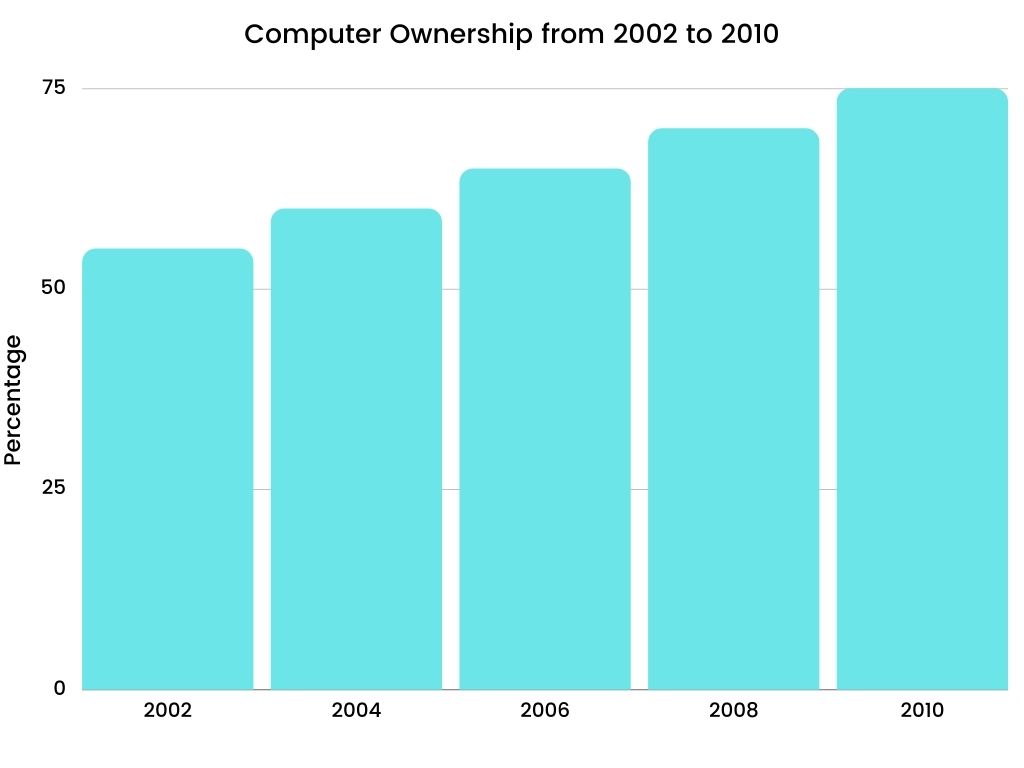
The graphs below give information about computer ownership as a percentage of the population between 2002 and 2010, and by level of education for the years 2002 and 2010.
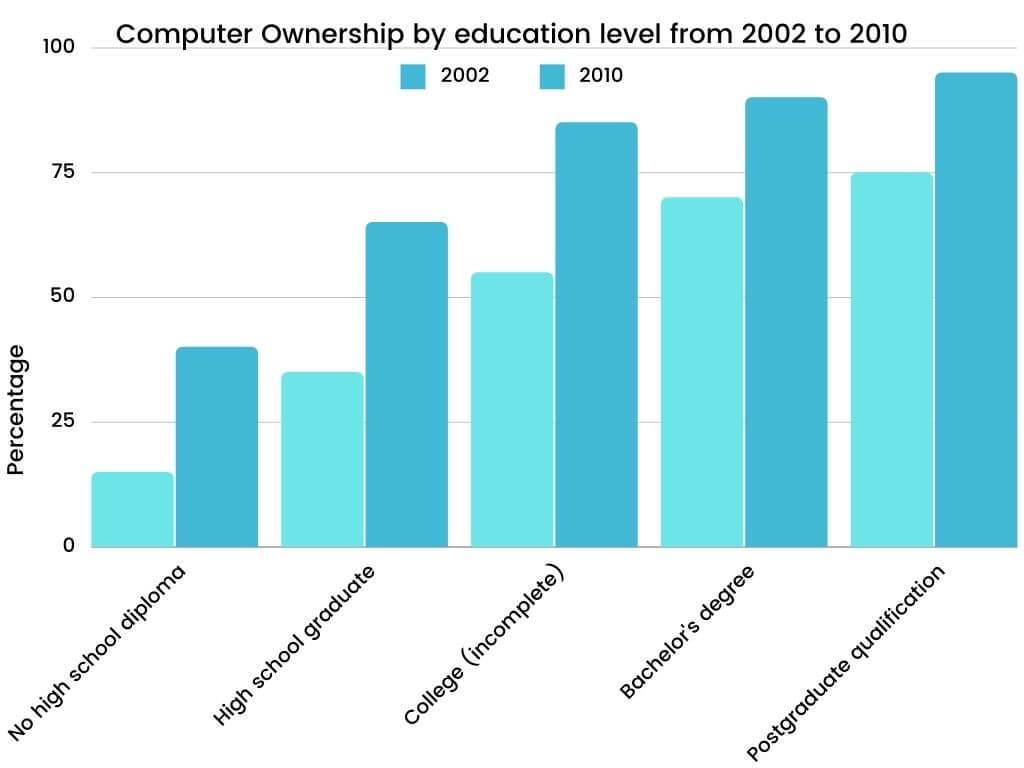
The bar graphs reveal data associated with computer ownership that is further classified by education level from year 2002 to 2010.
A stable but considerable rise can be observed in the proportion of people who owned computers over the given period. In 2002, only a bit more than half the population had computers, whilst three out of four people owned computer in year 2010.
Further, the second bar graph demonstrates that higher education levels correspond to higher computer ownership rates in both years. In 2002, only around 15% of the people who did not complete high school owned a computer, but this proportion got three times by year 2010. Apart from this, in year 2001, for those with a high school diploma or an unfinished college education, there were significant upsurges, of almost 30%, which reached up to 65% and 85% discretely in 2010. However, graduates and postgraduates had the greatest rates of ownership in 2010, at 90% and 95%, individually, which is 20% higher than 2002.
Comments
Post a Comment